
Using the Dynamic Report
Overview
The Dynamic Report lets you build your own performance report. You pick the date range, the metrics, and the filters, then run it. Use it to answer questions the standard reports can't: which campaigns convert best by month, how this period compares to the last one, or how traffic breaks down by device, location, or SubID.
Where to Start
Open the Dynamic Report from Reports → Dynamic Report.
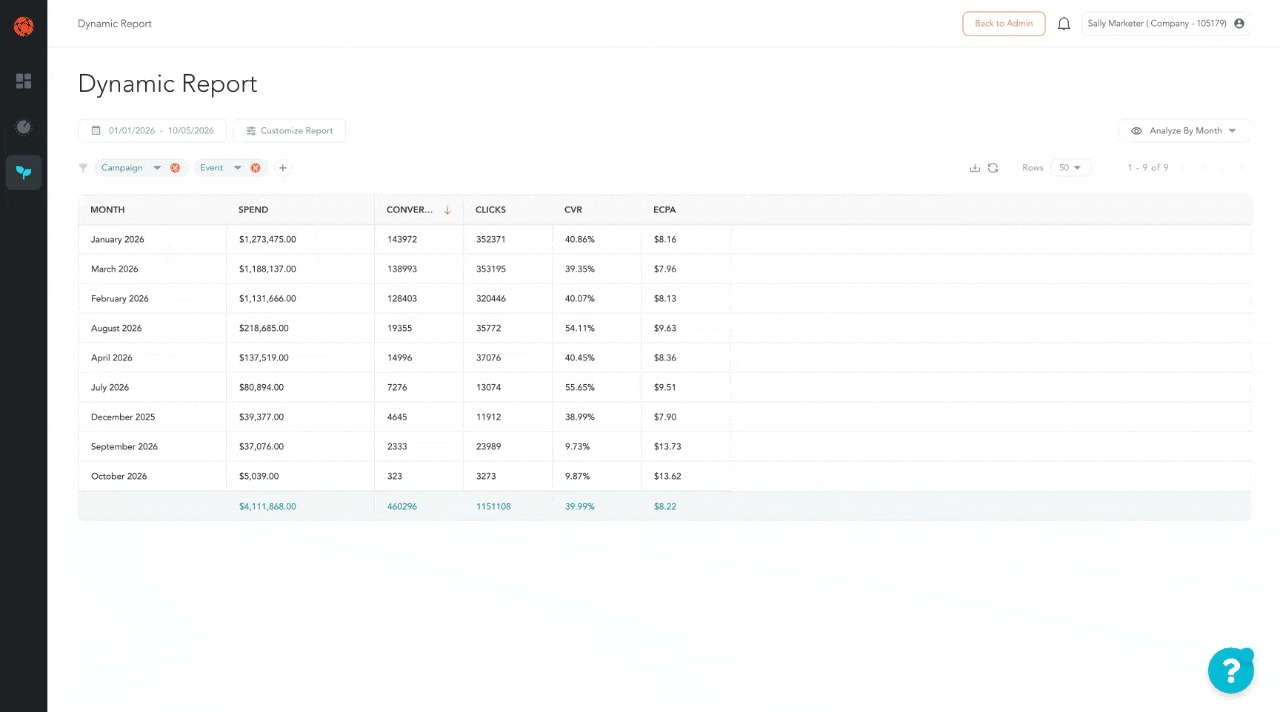
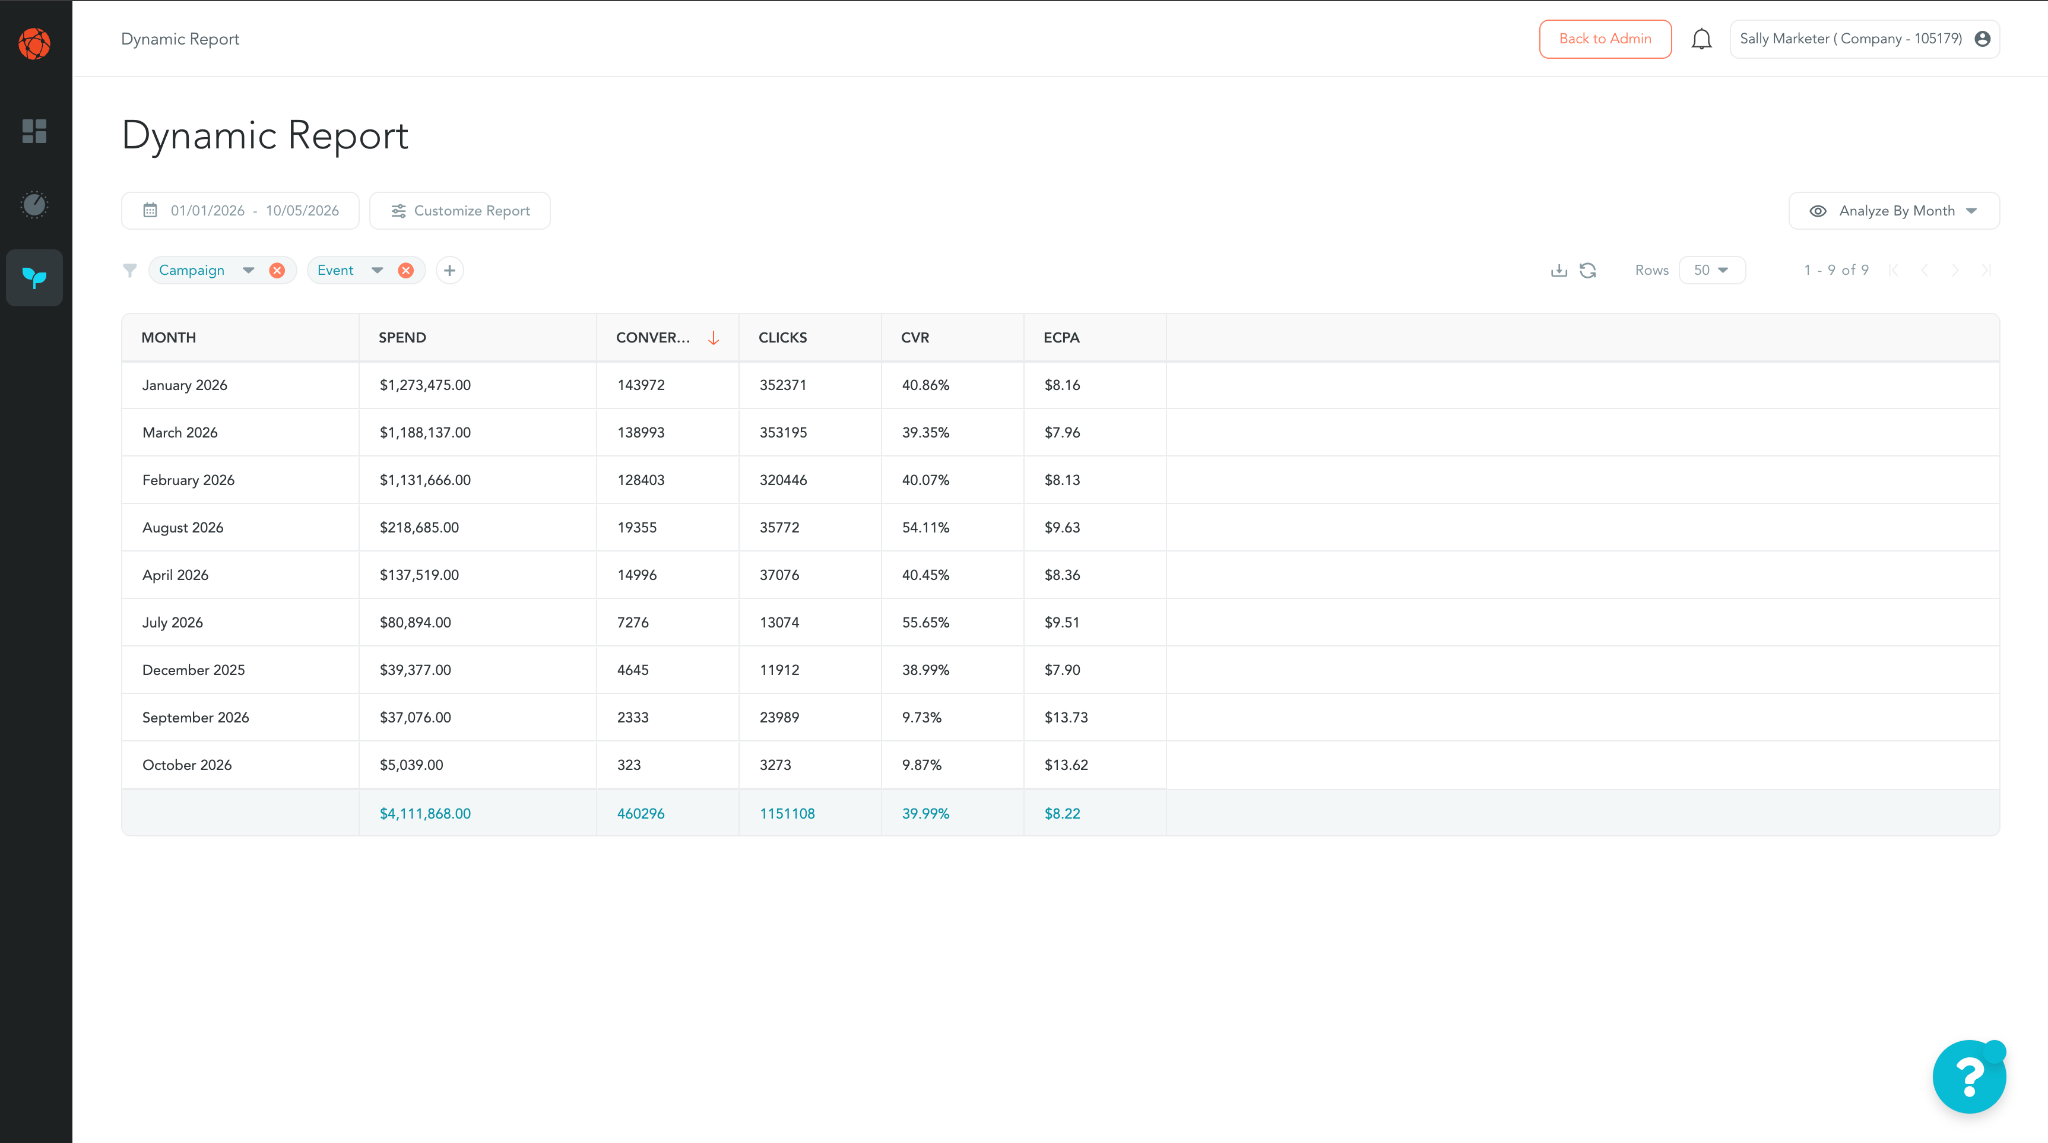
The report opens with the Analyze By Month view. It shows your year-to-date performance by month, so you see useful data right away. You can change anything from there.
Step 1: Pick a Date Range
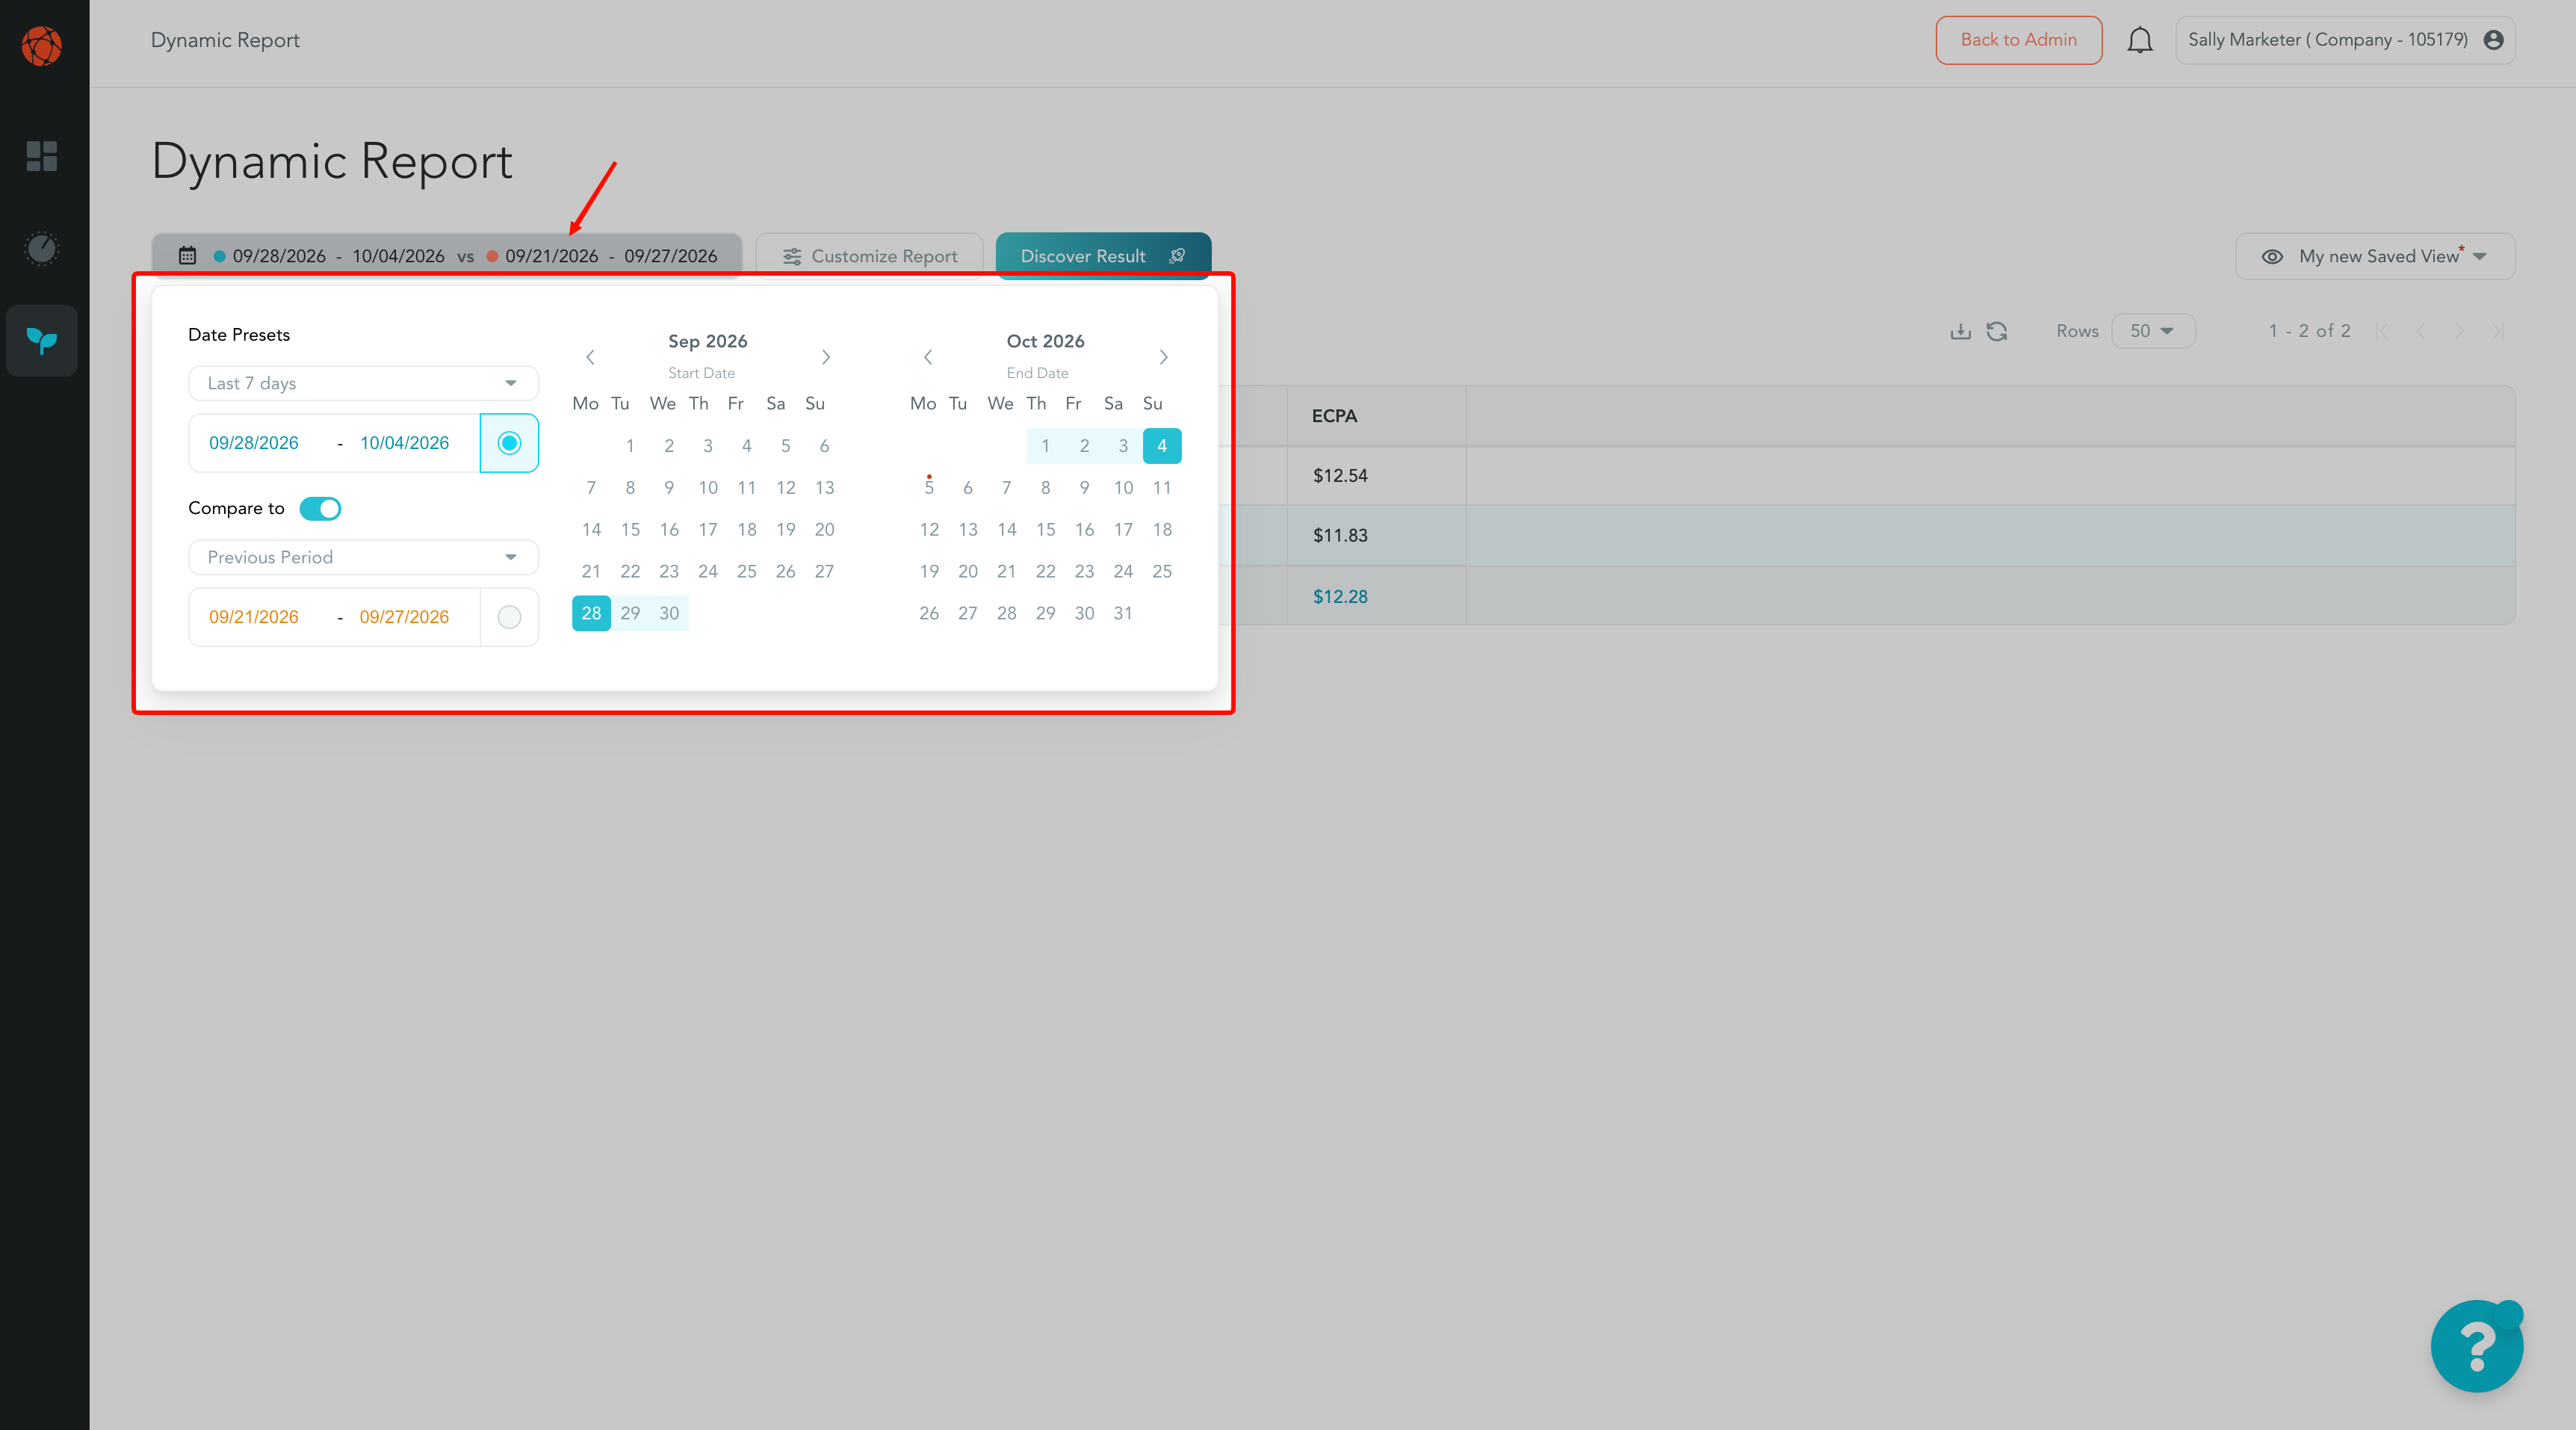
Use the date selector at the top of the report.
- Choose a preset (like Year to Date or Last Month), type the dates into the date fields, or pick them on the calendars.
- All dates and times show in EST.
Compare To
Turn on Compare To to see two date ranges side by side. It defaults to Previous Period.
When Compare To is on, each metric shows the value for both date ranges and the % Change between them.
Step 2: Customize Your Columns and Filters
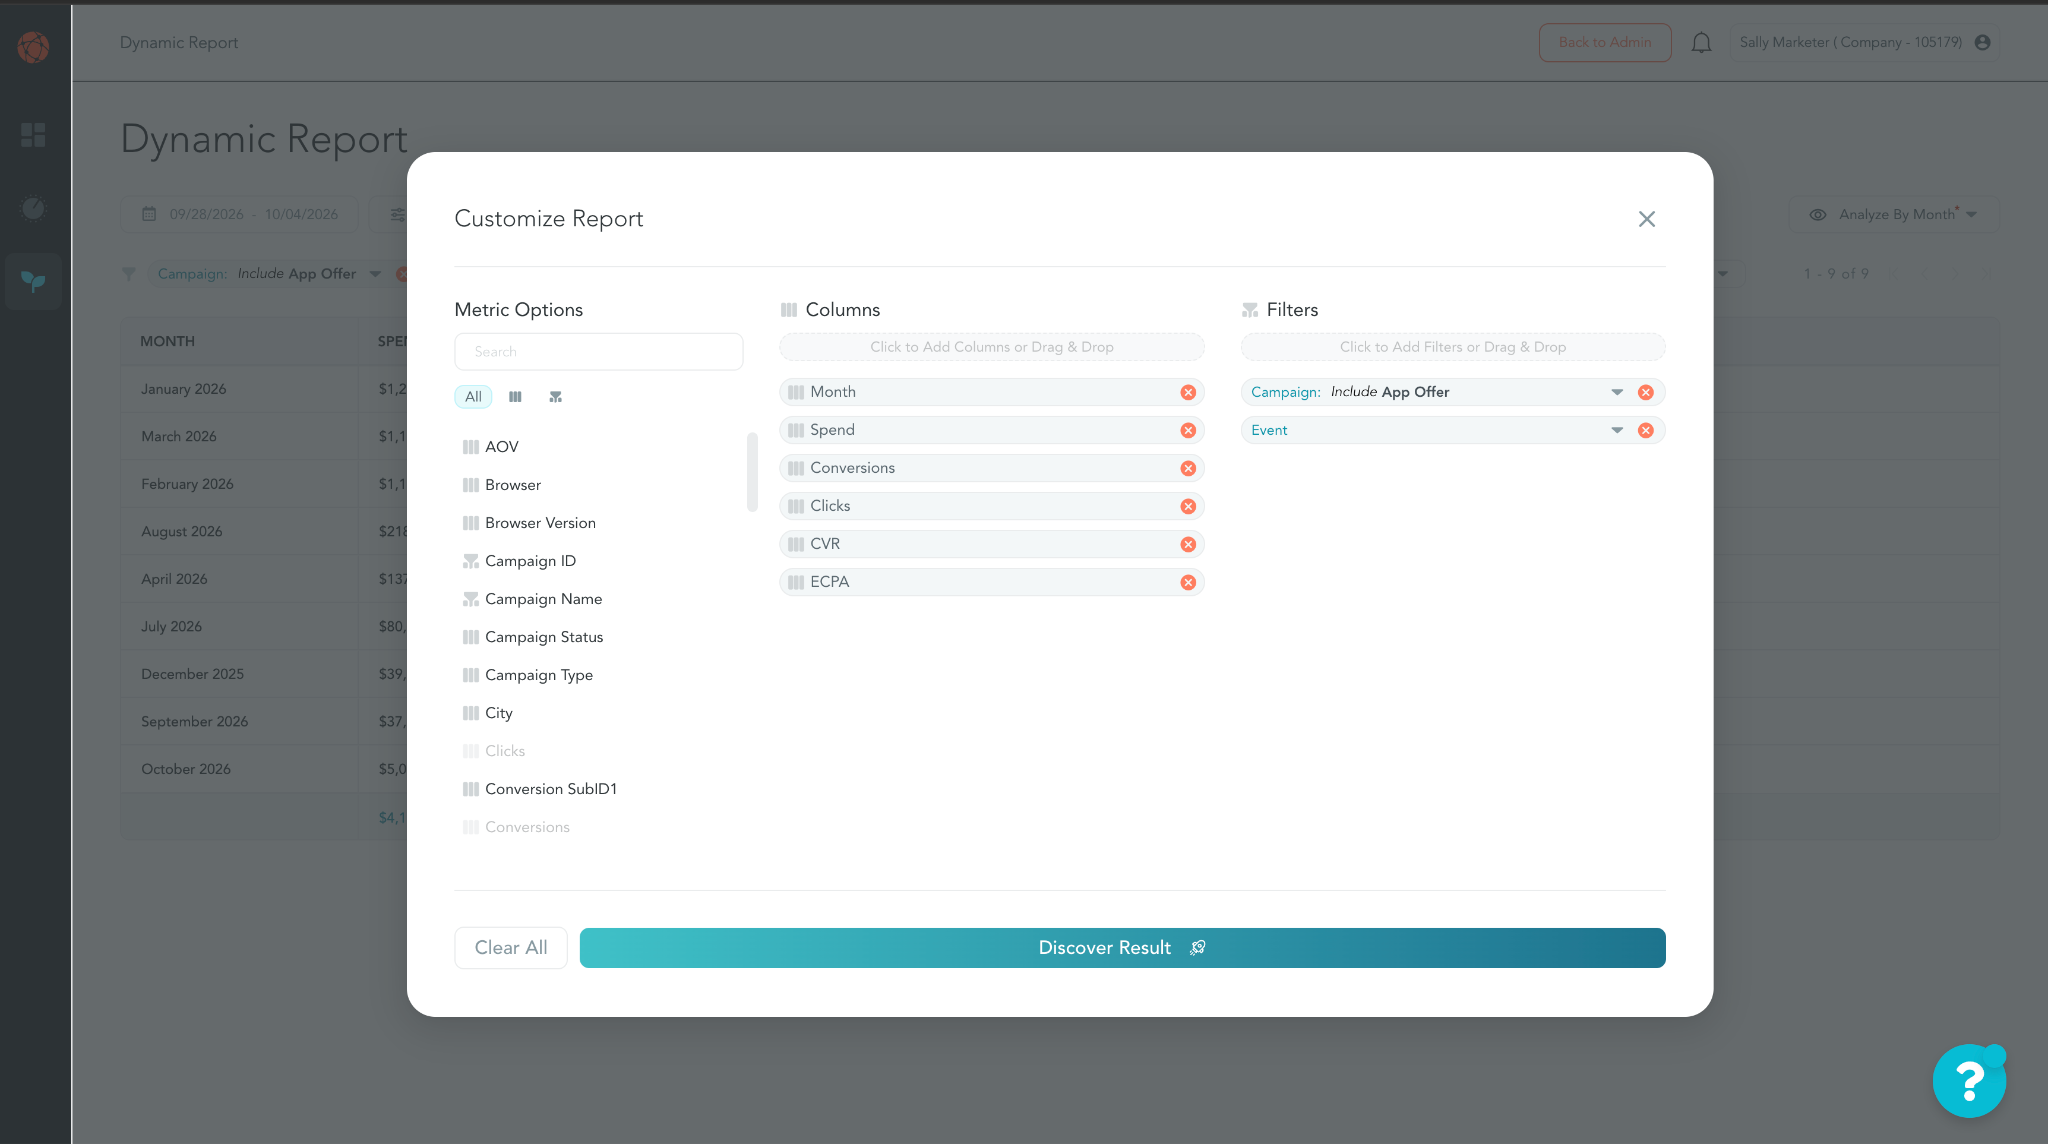
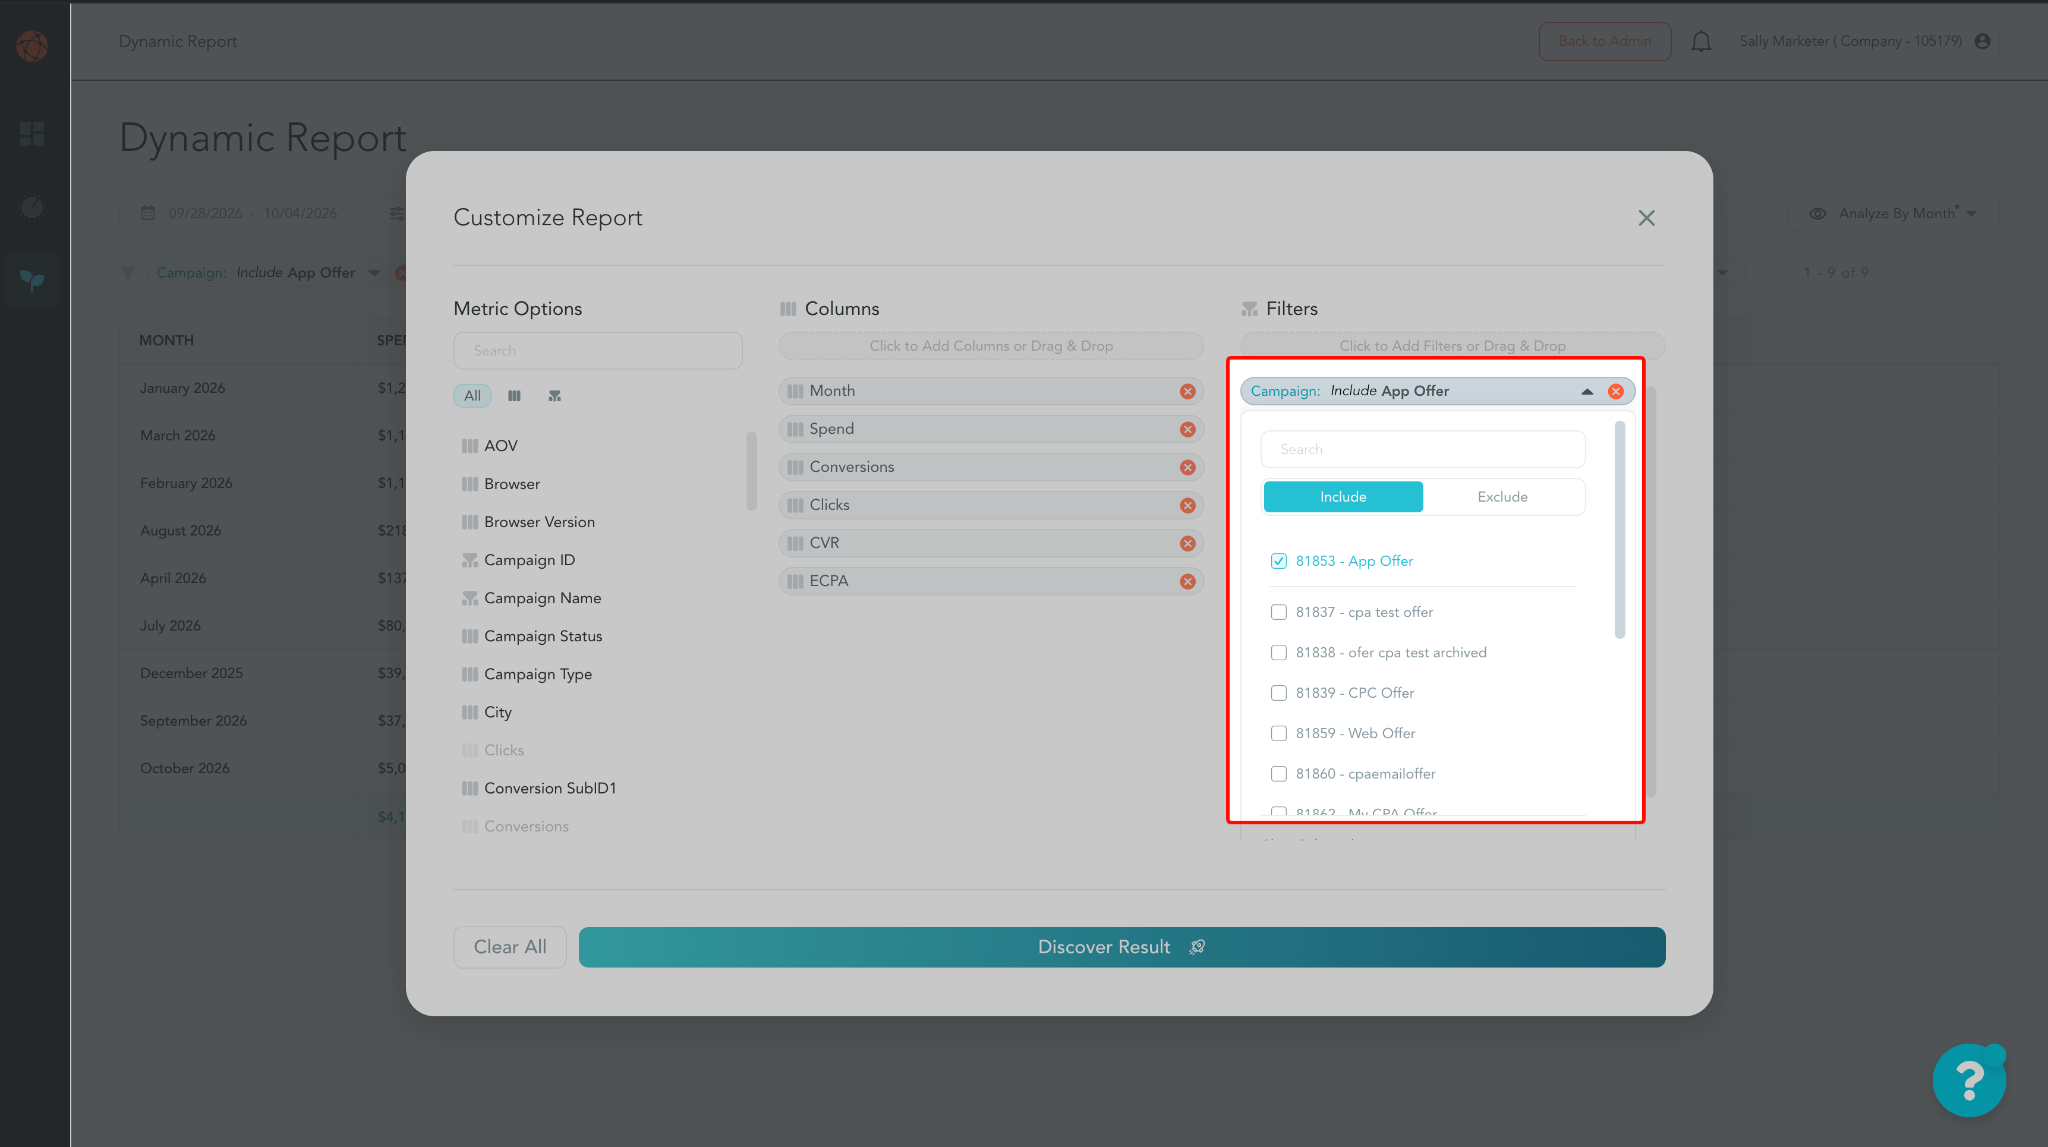
Click Customize Report to choose what the report shows.
The Customize Report window has three sections:
- Metric Options: every metric available to your account
- Columns: the metrics that show in the report table
- Filters: the metrics you can filter the report by
To build your report:
- Search for a metric, or scroll the Metric Options list.
- Drag it into Columns or Filters.
- Drag columns up or down to change their order in the table.
- Click the x next to a metric to remove it.
- Click Clear All to start over.
- Click Discover Results to run the report.
Some metrics can only be used as a column. Others can be used as a column or a filter. The icon next to each metric shows which. Hover over any metric to see its definition.
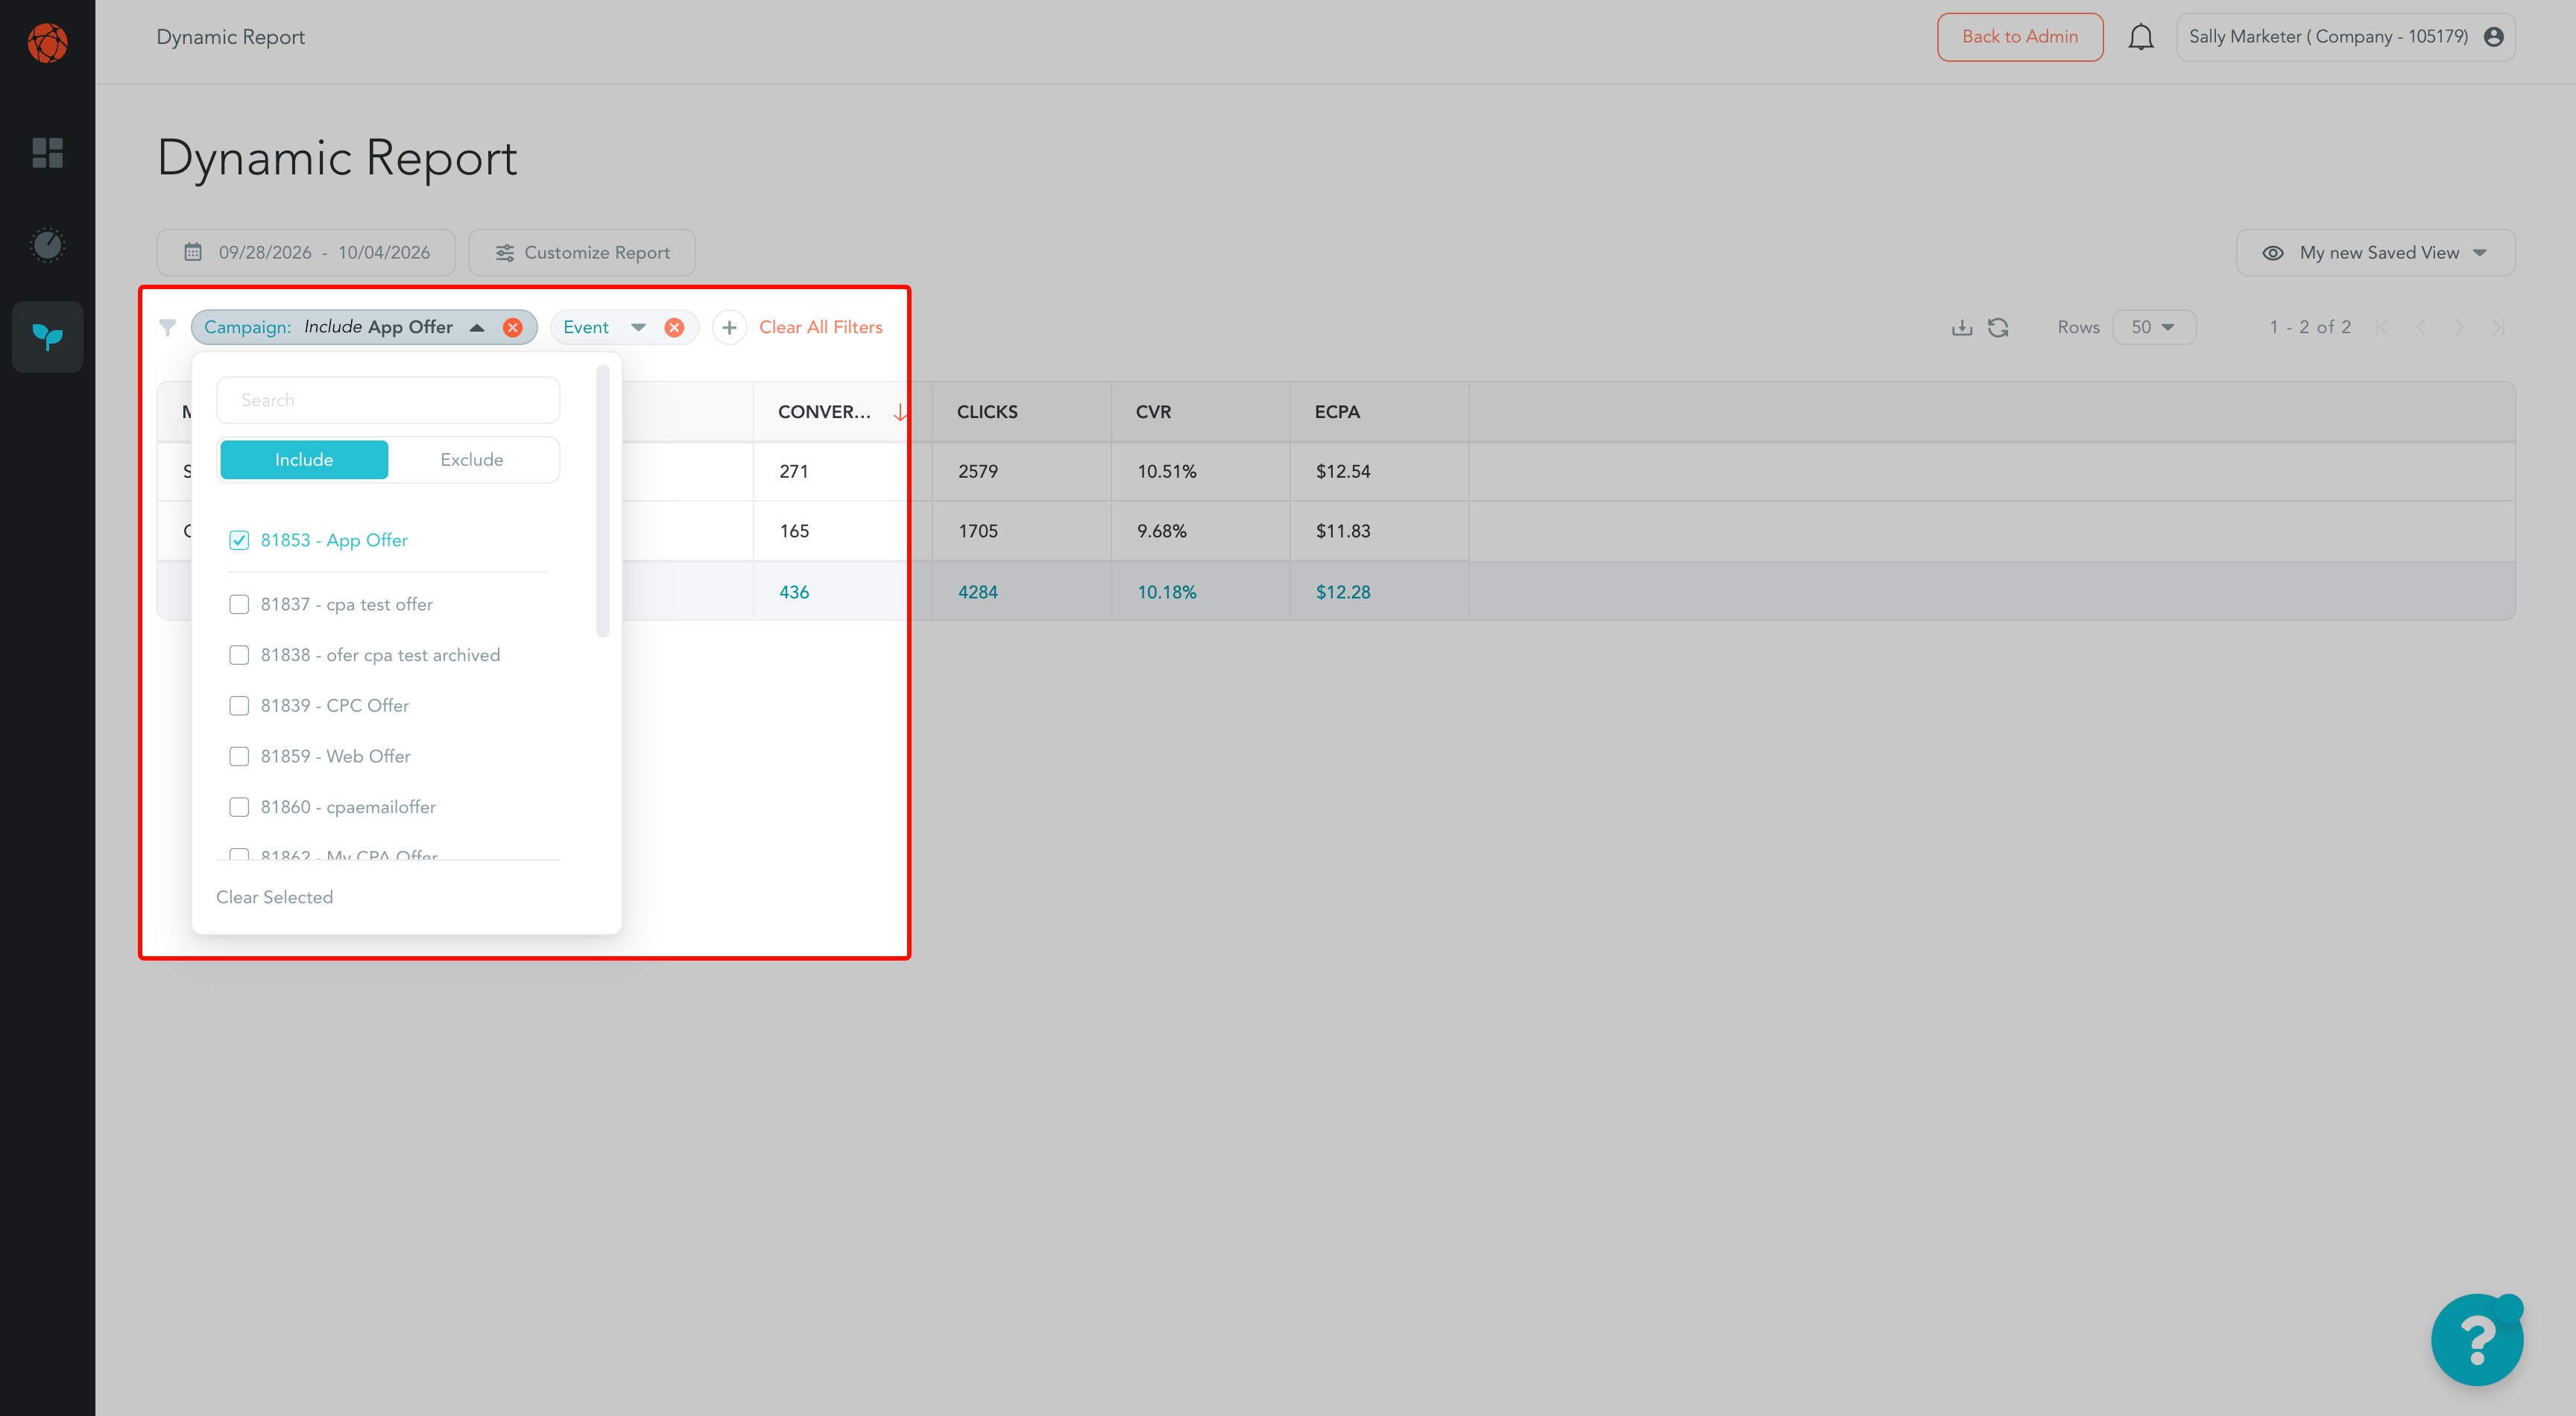
Filter Chips
Each filter you add shows up as a chip under the date selector, like Campaign: or Event:. Click a chip to choose the values you want. The dropdowns only list your own campaigns, events, creatives, and other values.
Step 3: Run the Report
Any time you change the date range, columns, or filters, the Discover Results button appears. Click it to run the report with your changes.
The report table:
- Shows 50 rows per page by default. Use the row selector to show 5, 10, 20, 50, or 100 rows.
- Uses the page selector at the bottom to move between pages.
- Shows a definition when you hover over a column header.
- Sorts by a column when you click its header.
Click Refresh to reload the data.
Large Reports and Date Limits
Some columns hold detailed data, such as SubIDs, City, Browser, Sale Amount, and ROAS. Because of data size, these columns have limits. When you add one, you'll see this note:
"Note: If any of these columns (AOV, Browser, Browser Version, City, Conversion SubID1, Creative Name, Creative Type, Device Name, Domain, ISP, Language, OS Version, Referrer Domain, ROAS, Sale Amount, Source ID, SubIDs) are included in your selection, date range will be limited to 180 days prior to today and the Compare To feature will be unavailable due to data size limitations."
In practice:
- If you add one of these columns, the date range is limited to the last 180 days and Compare To is turned off.
- If your date range is over 180 days, or Compare To is on, these columns are unavailable.
- Date presets that go beyond 180 days, like Year to Date, are disabled while one of these columns is in your report.
Download Your Report
Click the download icon to save the report as a CSV file. The file downloads straight to your browser.
The export matches what you see:
- Only the data from the report you ran, with your filters applied
- Columns and rows in the same order as the table
- Column names that match the report
Saved Views
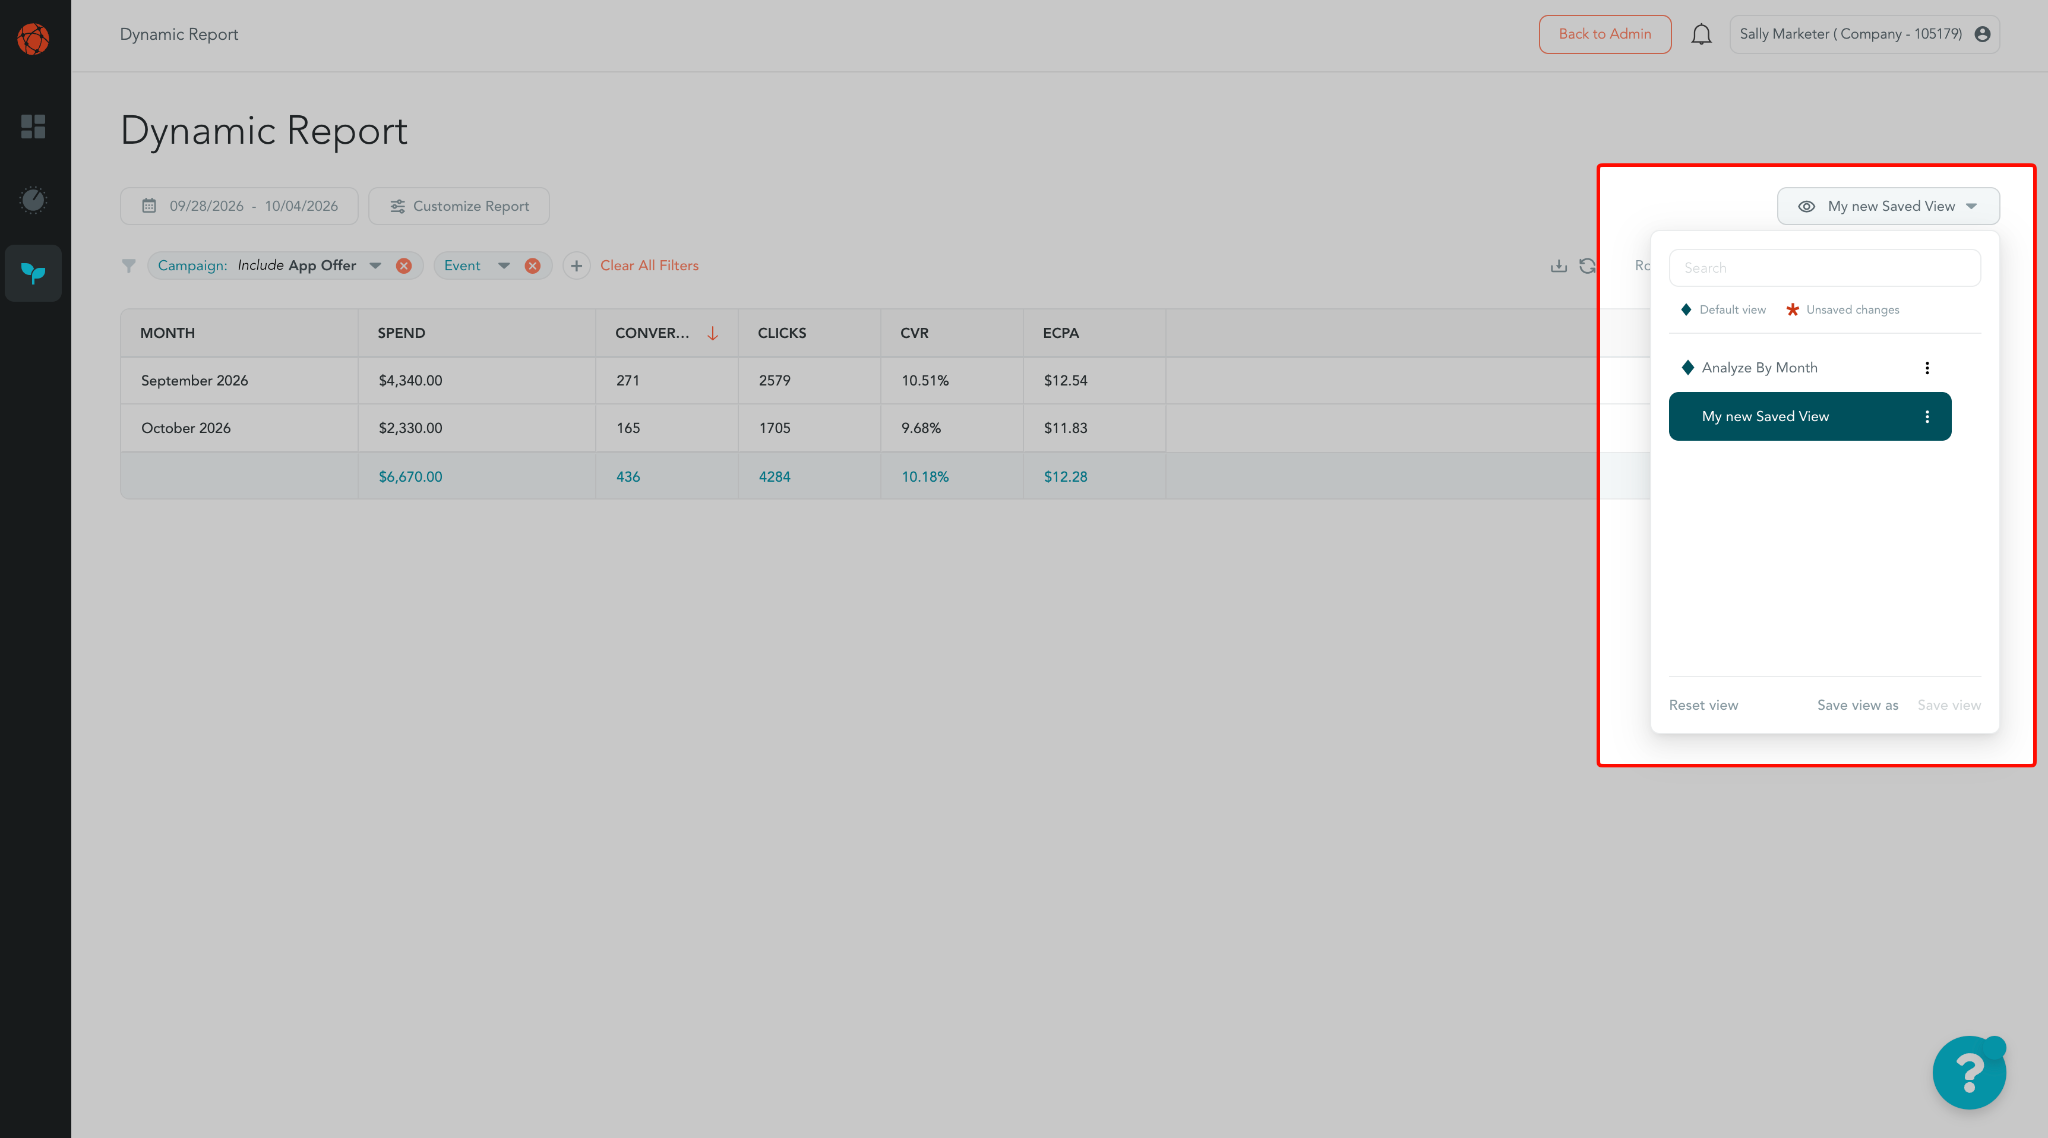
Saved Views let you save a report setup and load it again with one click. A saved view keeps your columns, filters, date range, and sorting.
Views are shared across your account. Anyone logged into your marketer account can see and use every saved view in it. Your Perform[cb] account team can also create views for you.
Save a New View
- Set up the report the way you want it.
- Open the saved views dropdown and click Save View As.
- Enter a View Name and save.
When a view has unsaved changes, an asterisk (*) appears next to its name.
Update, Reset, or Switch Views
- Save View: updates the current view with your changes.
- Reset View: undoes your changes and goes back to the view's last saved state.
- To switch views, select one from the saved views dropdown. The report runs with that view's settings.
Manage Your Views
Click the three-dot menu next to a view to:
- Set as default: this view opens every time you open the Dynamic Report. A diamond icon marks your default view.
- Delete the view.
Analyze By Month always appears first in the list. You can set it as your default, but you can't delete it. All other views are listed A–Z below it.
Things to Know
- Saved views are shared across your account. You can't make a view private. Clicking Save View changes it for everyone on your account, so use Save View As if a teammate relies on the original.
- Times are in EST.
- Detailed columns are limited to 180 days. See "Large Reports and Date Limits" above.
FAQs
Q: Why can't I select Year to Date? A: Your report includes a column that's limited to the last 180 days, such as a SubID, City, or ROAS. Remove that column to use longer date ranges.
Q: Why is Compare To greyed out? A: Compare To isn't available when your report includes one of the detailed columns listed in "Large Reports and Date Limits." Remove the column to turn Compare To back on.
Q: Can I make a saved view that only I can see? A: No. All saved views are visible to everyone logged into your marketer account. Add your name to the view's name if you want to keep track of your own.
Q: I don't see a metric I need. Can it be added? A: Contact your Perform[cb] account team with the metric you're looking for.